miniblog.
← Back to all posts
May 8, 2021 at 19:14
1
How to make Rust code faster, including profiling, LLVM whole-crate optimisation, and avoiding costly error checks:
https://likebike.com/posts/How_To_Write_Fast_Rust_Code.html
Likes
Michael Connor Buchan
Related Posts
Feb 4, 2023 at 09:13
Short and very accessible introduction to implementing unification, including Python sample code:
Unification - Eli Bendersky's website
Dec 14, 2022 at 02:48
Apple is going to significantly open up iPhones, including allowing third party app stores!
Apple to Allow Outside App Stores in Overhaul Spurred by EU Laws
Apple Inc. is preparing to allow alternative app stores on its iPhones and iPads, part of a sweeping overhaul aimed at complying with strict European Union requirements coming in 2024.
Sep 3, 2022 at 01:50
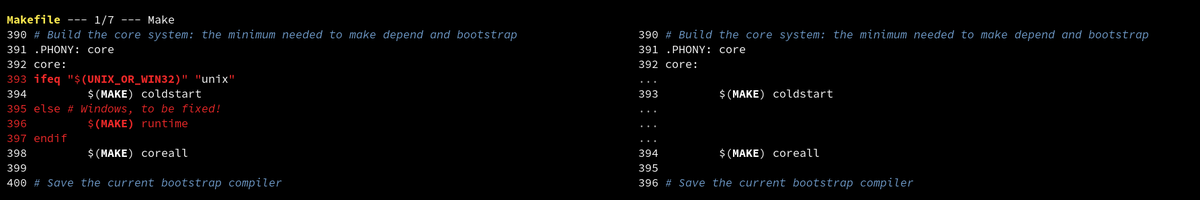
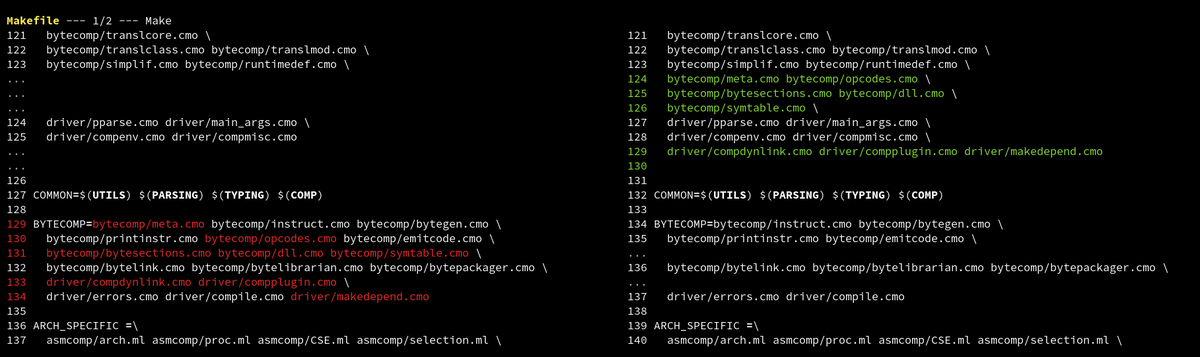
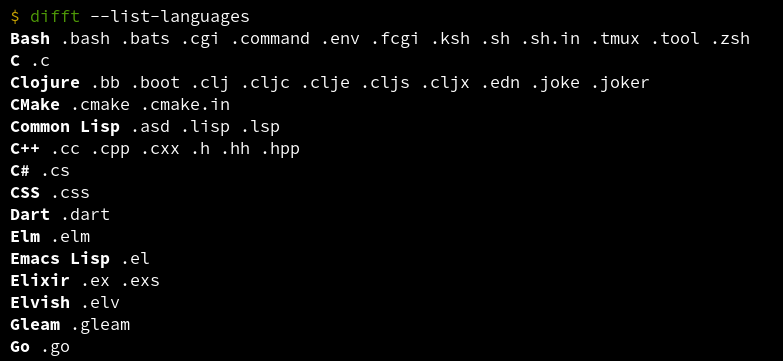
I've released difftastic 0.35! In this release: * Basic support for Makefile syntax * Support for UTF-16 files (helpful on Windows) * Several quality of life improvements, including the ability to see what languages are currently supported
Release 0.35.0 · Wilfred/difftastic
Difftastic is a structural diff tool that understands syntax. See the manual to get started, and the changelog for historical changes. Diffing Difftastic now fixes sliders in more cases, producing ...