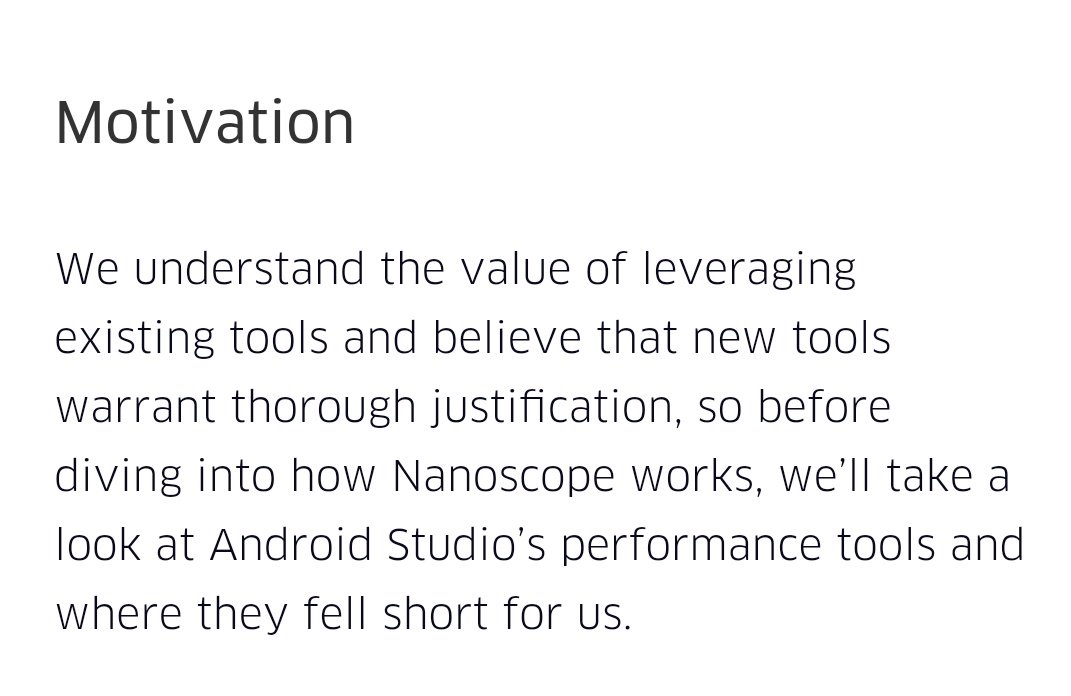
The more words an open source tool devotes to the alternatives, the better engineered it tends to be IME. From Uber's article about their method profiler:
I like the concept of a REPL: an interactive environment where you can redefine code and evaluate snippets to see the result.
I try to avoid the term "REPL" though. Most languages don't use "read" for parsing (the R) and it's confusing. Are there good alternatives?
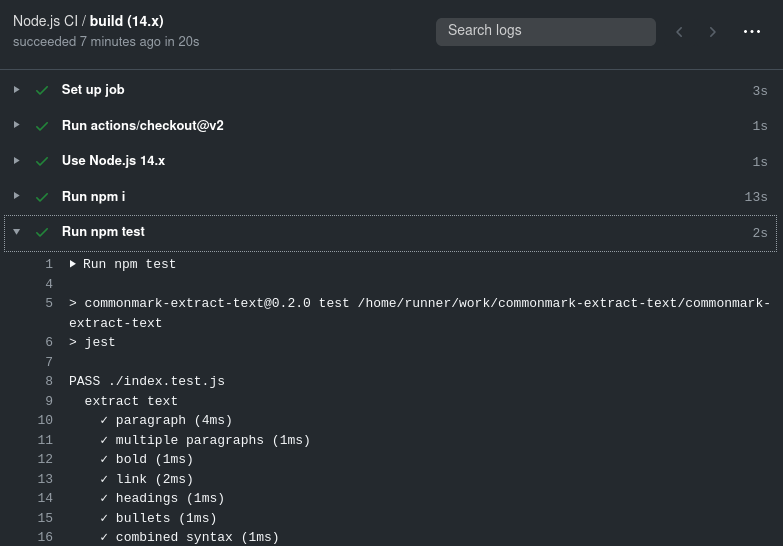
Playing with GitHub actions today, and I realise how much testing services have become a commodity.
I really appreciate GitHub's organised, collapsible UI for output. The featureset seems comparable to alternatives though.
(The idea of an ecosystem of actions is tempting!)
It's striking how many Docker features get ported when people build alternatives. It's a great day of easing migration.
Podman deliberately mimics Docker's CLI and can even run Docker images!