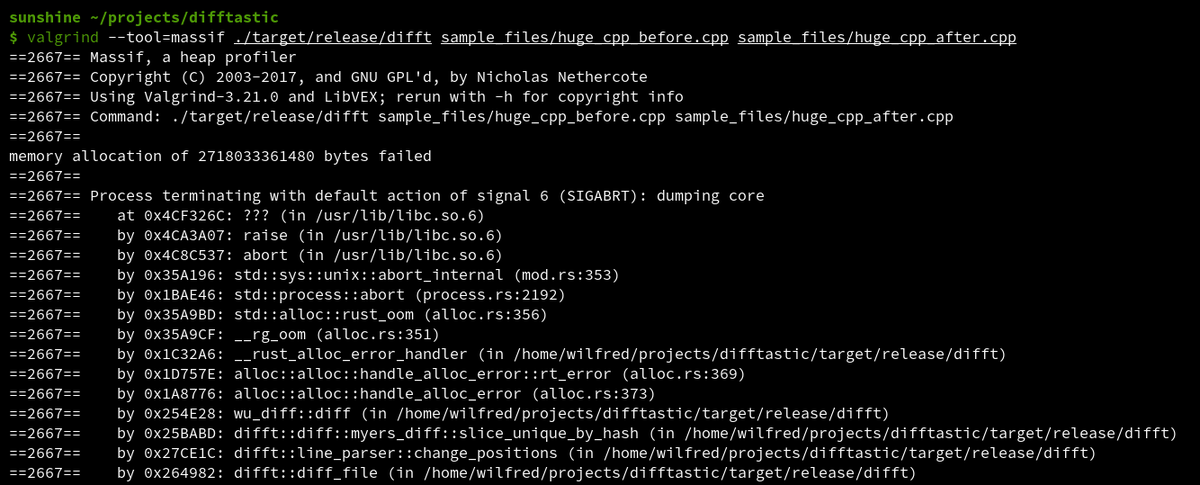
I've been learning how to use Massif, a tool in valgrind for memory profiling. It quickly paid off!
I discovered that difftastic sometimes attempts to preallocate absurd amounts of memory.
I've been impressed with code written by Fable in my testing:
Difftastic: found small optimisations in a hot loop I'd already profiled extensively. Helped me prototype Dijkstra to A* too (hard to find a good heuristic).
Garden: Found some real bugs in my simplistic typechecker.
Difftastic 0.69 is out! This is a pretty big release:
* Semantically insignificant commas are now ignored
* Difftastic now respects .gitattributes
* Added assembly support and improved 13 other languages
I've released difftastic 0.68! A smaller update, but still worth upgrading:
* Improved Bash, C, Go, Lua, Nix, Perl, Python, Rust, Scala, Swift and YAML parsing.
* Minor display and git compatibility fixes.